
Excel library
Excel Formula to Count Unique Values
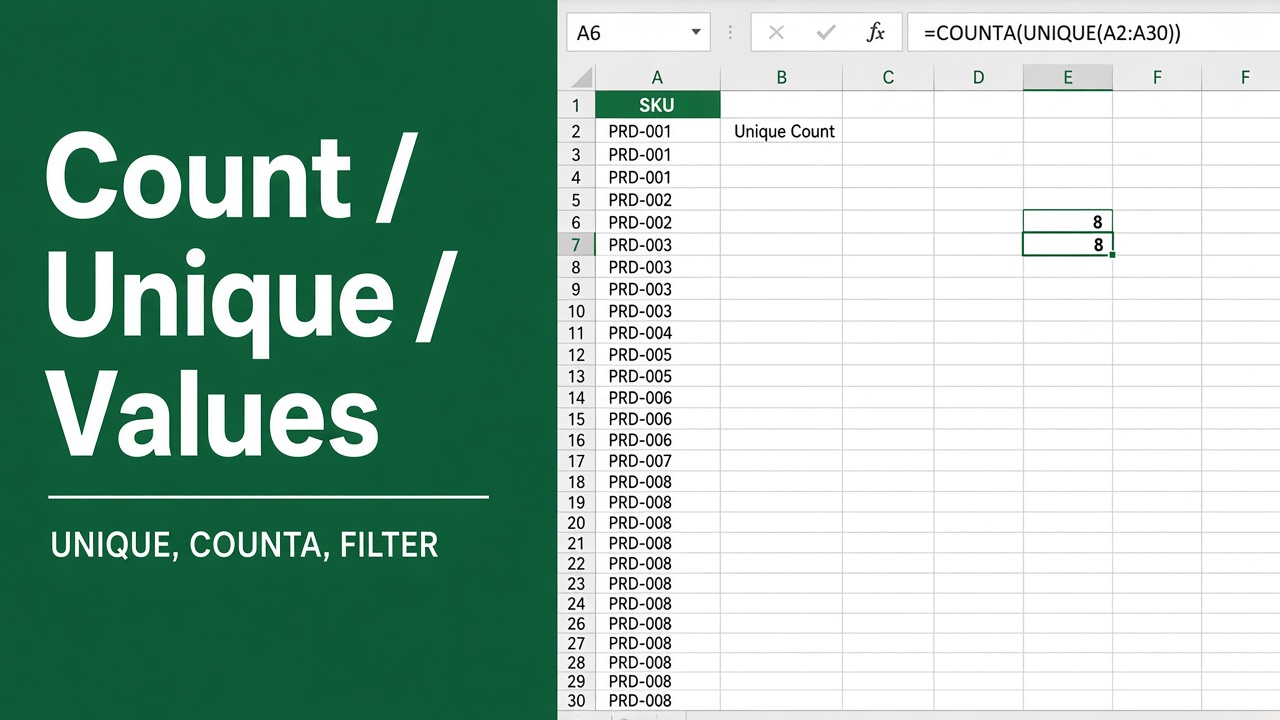
Counting unique values answers questions like “how many different customers ordered this month?” or “how many products are in this list?”. There is no single COUNTUNIQUE function, but one short formula does the job in any version of Excel, and Microsoft 365 makes it shorter still.
Quick answer: in Microsoft 365 or Excel 2021, use =COUNTA(UNIQUE(A2:A9)). In any version, use =SUMPRODUCT(1/COUNTIF(A2:A9,A2:A9)).
Distinct Values vs Unique Values
“Unique” is used for two different counts, so decide which one you need first. Take this list in A2:A9:
| Names |
|---|
| John |
| Emma |
| Liam |
| Emma |
| Oliver |
| John |
| Amelia |
| Liam |
- Distinct values: every different name, counted once. John, Emma, Liam, Oliver and Amelia: 5. This is what most people mean by “count unique values”.
- Values that appear only once: names with no duplicates. Only Oliver and Amelia: 2.
The formulas below give the distinct count unless they say otherwise.
Method 1: COUNTA and UNIQUE (Microsoft 365, Excel 2021 and Later)
=COUNTA(UNIQUE(A2:A9))UNIQUE returns the list of different names (John, Emma, Liam, Oliver, Amelia) and COUNTA counts them: 5.
Useful variations:
- Ignore blank cells:
=IFERROR(ROWS(UNIQUE(FILTER(A2:A9,A2:A9<>""))),0). Without FILTER, an empty cell is counted as one extra value. IFERROR returns 0 when the range is completely empty. - Count only values that appear once:
=COUNTA(UNIQUE(A2:A9,,TRUE))returns 2. The third argument of UNIQUE, exactly_once, keeps only values with no duplicates. - Count with a condition: with regions in B2:B9,
=COUNTA(UNIQUE(FILTER(A2:A9,B2:B9="East")))counts the different names in the East region. Wrap it in IFERROR as above if no rows might match. - Ignore extra spaces:
=COUNTA(UNIQUE(TRIM(A2:A9)))treats “John” and “John ” as the same name. - Across several columns:
=COUNTA(UNIQUE(TOCOL(A2:C9,1)))stacks the columns into one list, skipping blanks, before counting.
Method 2: SUMPRODUCT and COUNTIF (Any Version)
=SUMPRODUCT(1/COUNTIF(A2:A9,A2:A9))This works in every version of Excel and returns 5 for the list above. Here is why:
COUNTIF(A2:A9,A2:A9)counts how many times each name appears: John 2, Emma 2, Liam 2, Emma 2, Oliver 1, John 2, Amelia 1, Liam 2.1/turns each count into a fraction: a name that appears twice contributes 1/2 each time, so its two rows add up to 1.- SUMPRODUCT adds the fractions. Every different name adds exactly 1, so the total is the number of distinct names.
If the range has blank cells, that formula returns #DIV/0!. Use this version, which counts nothing for blanks:
=SUMPRODUCT((A2:A9<>"")/COUNTIF(A2:A9,A2:A9&""))To count values that appear only once in older versions, count the rows whose COUNTIF result is 1:
=SUMPRODUCT(--(COUNTIF(A2:A9,A2:A9)=1))COUNTIF compares every cell with every other cell, so on tens of thousands of rows it becomes slow. For large lists, use UNIQUE (Method 1) or a pivot table (Method 4).
Method 3: FREQUENCY for Numbers
For a range of numbers or dates, FREQUENCY is fast and ignores blanks and text automatically:
=SUM(--(FREQUENCY(A2:A9,A2:A9)>0))In Excel 2019 and earlier, confirm it with Ctrl+Shift+Enter. Numbers stored as text are skipped, so convert them first (select the cells and use the warning icon’s Convert to Number) if the count looks low.
To count unique years, months or days in a column of dates in Microsoft 365, combine UNIQUE with the date function: =COUNTA(UNIQUE(YEAR(A2:A9))) counts the different years.
Method 4: Distinct Count in a Pivot Table
For large data, or when you need the count broken down by category, a pivot table can count distinct values without formulas:
- Select the data and choose Insert > PivotTable.
- Tick Add this data to the Data Model and click OK.
- Drag the field you want to count into Values.
- Click the field in Values > Value Field Settings > choose Distinct Count > OK.
Drag another field, such as Region, into Rows to see the distinct count for each region. Distinct Count only appears when the data is in the Data Model.
Method 5: Advanced Filter (No Formula)
- Select the column, including its header.
- Go to Data > Advanced (in the Sort & Filter group).
- Choose Copy to another location, pick an empty cell under Copy to, and tick Unique records only.
- Click OK. Select the copied list and read the Count on the status bar, remembering that it includes the header.
This gives a fixed snapshot: the copy does not update when the source changes. Data > Remove Duplicates does the same job on a copy of the data.
Which Method to Use
| Situation | Use |
|---|---|
| Microsoft 365 or Excel 2021+ | =COUNTA(UNIQUE(range)) |
| Older Excel, small or medium list | =SUMPRODUCT(1/COUNTIF(range,range)) |
| Older Excel, numbers only | =SUM(--(FREQUENCY(range,range)>0)) |
| Large data or counts by category | Pivot table with Distinct Count |
| One-off count, no formula | Advanced Filter > Unique records only |
Things That Change the Count
- Case: COUNTIF and UNIQUE both ignore case, so “john” and “John” count once. That is usually what you want.
- Extra spaces: “John” and “John ” are different values. Clean them with TRIM (or the TRIM variation in Method 1).
- Numbers stored as text: the text “10” and the number 10 are different values to UNIQUE. Convert text numbers before counting.
- Blank cells: UNIQUE counts a blank as one value and the basic SUMPRODUCT formula returns #DIV/0!. Use the blank-safe versions above.
Final Thoughts
In Microsoft 365, =COUNTA(UNIQUE(range)) is the simplest way to count distinct values, with FILTER added to skip blanks or apply a condition. In older versions, =SUMPRODUCT(1/COUNTIF(range,range)) does the same job. For big data sets or counts per category, let a pivot table’s Distinct Count do the work.
FAQs
What is the formula to count unique values in Excel?
In Microsoft 365 or Excel 2021, use =COUNTA(UNIQUE(A2:A100)). In any version, use =SUMPRODUCT(1/COUNTIF(A2:A100,A2:A100)). Both count each different value once.
What is the difference between distinct and unique values in Excel?
Distinct values are all the different values, each counted once. Unique values, in the strict sense, are values that appear only once. In John, Emma, John, the distinct count is 2 and the count of values appearing once is 1.
How do I count unique values while ignoring blank cells?
In Microsoft 365, use =IFERROR(ROWS(UNIQUE(FILTER(A2:A100,A2:A100<>""))),0). In older versions, use =SUMPRODUCT((A2:A100<>"")/COUNTIF(A2:A100,A2:A100&"")).
Can I count unique values without a formula?
Yes. Create a pivot table with Add this data to the Data Model ticked and set the value field to Distinct Count, or use Data > Advanced with Unique records only and read the count on the status bar.
Why does my unique count formula return #DIV/0!?
The range contains blank cells, and COUNTIF returns 0 for them, so 1/COUNTIF divides by zero. Use =SUMPRODUCT((A2:A100<>"")/COUNTIF(A2:A100,A2:A100&"")) instead.
Which Excel versions have the UNIQUE function?
UNIQUE is available in Microsoft 365, Excel 2021, Excel 2024 and Excel for the web. In Excel 2019 and earlier, use the SUMPRODUCT and COUNTIF formula instead.